
Read the logs and results dashboard
The Logs and Results panel shows live stat cards, a streaming log and a per-visit results table. Success rate is the number to watch: it tells you whether the problem is your proxies, your target site, or your thread count.
This panel is where you find out whether a run is working, and why it is not.
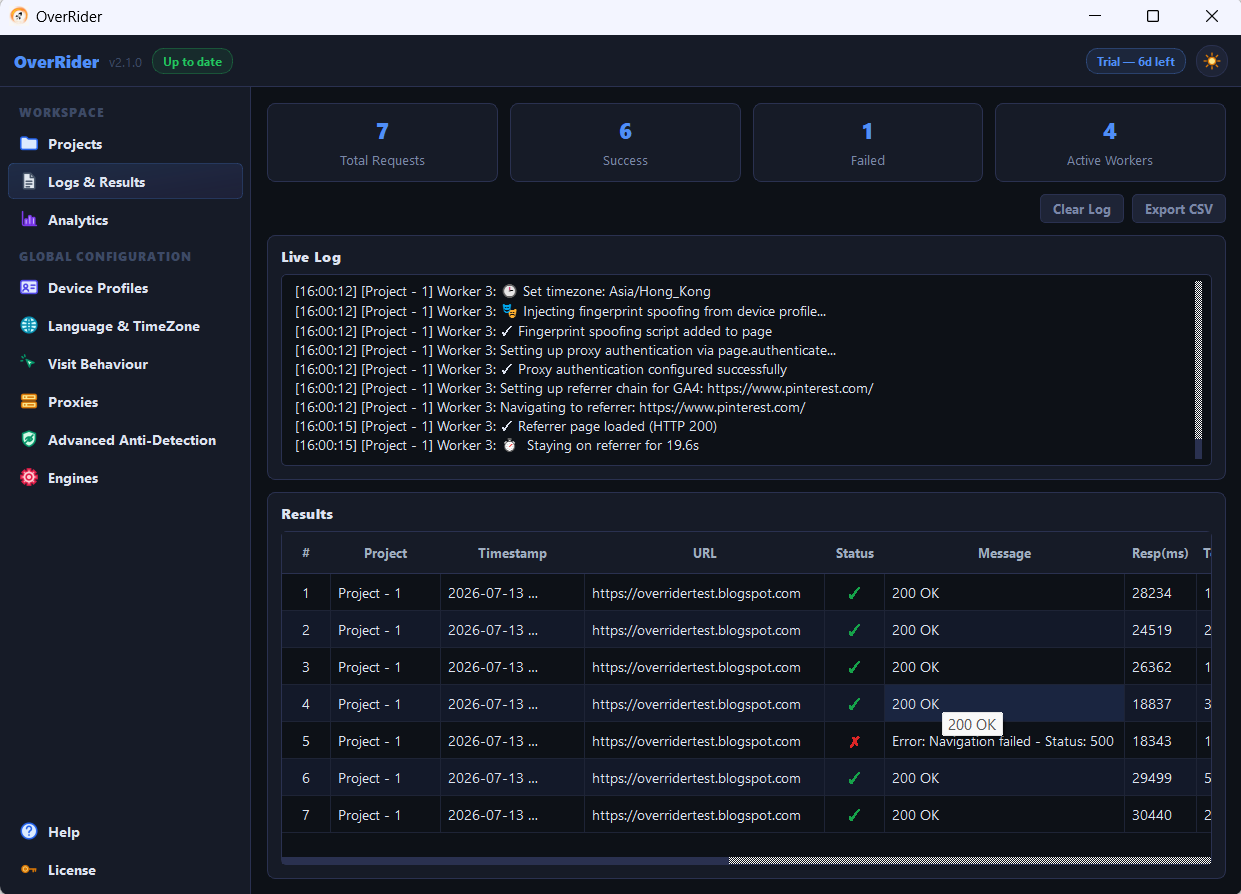
The stat cards
| Card | What it means |
|---|---|
| Total visits | Visits attempted so far |
| Successful | Visits that loaded the target page and completed their behaviour |
| Failed | Visits that could not complete |
| Success rate | The percentage worth watching |
The top bar aggregates every running project; each project’s own card shows its individual figures.
What the success rate is telling you
| Rate | Likely situation |
|---|---|
| Over 90% | Paid proxies, or no proxies. Healthy. |
| 20 to 40% | Normal for free public proxies. |
| Under 10% | Something is wrong — read the log rather than guessing. |
| Falls as threads rise | Your machine or connection is saturated. Lower the thread count. |
A high success rate means OverRider completed the visits. It does not guarantee your analytics recorded them — GA4 filters known bot IP ranges, and Load JavaScript must be on. If successes are high but analytics is empty, see Traffic is not showing in Google Analytics.
The live log
The log streams events as they happen: browsers launching, referrers loading, pages loading, behaviour running, and any errors.
When something is wrong, this is the first place to look. What the error says determines what to fix:
| Log message | Fix |
|---|---|
| Connection refused / timeout / proxy error | Dead proxies. Shorten the re-check interval or use paid proxies. |
| HTTP 407 | Wrong proxy credentials, or a password needing percent-encoding. |
| HTTP 403 or a challenge page | The site is blocking you. More proxies will not help; residential ones might. |
| Page load timeout | Slow proxies, or too many threads for your machine. |
| Browser executable not found | The selected engine is not installed. |
The results table
One row per visit, with its status. Use it to spot patterns the aggregate hides — for example one target URL failing while the others succeed, which points at that URL rather than at your setup.
Statistics after a run ends
Final figures remain visible after a project finishes or is stopped, so you can review a completed run without it resetting to zero.
Cross-checking with your analytics
The most useful diagnostic is the gap between OverRider’s success count and what your analytics reports:
- Both roughly equal — everything is working.
- OverRider high, analytics near zero — the tag is not firing, or the traffic is being filtered as bot activity.
- Both low — a traffic problem. Read the log.
Remember GA4 standard reports lag by up to 48 hours. Compare against Realtime while the project runs.
Last updated: